July 22, 2026

TSX60 Series
TSX60 Research - Short-Term Incentive Plans
How Annual Incentives Evolved in 2025: Are STI Plans Becoming More Tailored? Across the TSX60, short-term incentives typically represent around a quarter of an executive’s total direct compensation. In 2025, they once again paid out above target for most companies. These awards are driven predominantly by corporate performance, with individual components playing a shrinking supporting role.
Download the article here

Download the article here

This article builds on our Executive Pay Insights from June, drawing on disclosed 2025 compensation from TSX60 companies to examine how plans paid out, how scorecards and metrics are evolving, and how boards are using discretion to shape outcomes and new plan features to drive specific initiatives/transformation.
Year-Over-Year Snapshot – How Short-Term Incentive (STI) Plans
Changed in 2025 Strong business performance once again translated into above-target STI payouts across the TSX60. Energy continued to lead the index, while Financial Services posted the largest year-over-year rebound as the major banks recovered from a weaker 2024. Most TSX60 companies paid above target for the CEO, with only eight paying out below target out of those that disclosed.
Overall, STI design remained relatively stable in 2025, with companies continuing to make incremental refinements rather than wholesale changes. Additive plans remained the market standard, while multiplicative designs were relatively less common.
Organizations continued to place greater emphasis on corporate performance for executives (80%+), reinforcing a broader focus on collective accountability. Scorecards became slightly more streamlined, but continued to maintain a strong weighting toward financial metrics (~67%).
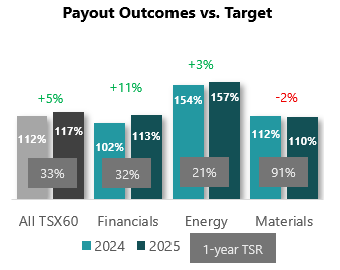
STI outcomes remained above target across the TSX60 despite continued economic uncertainty, with the average corporate multiplier increasing from 110% in 2023 and 112% in 2024 to 117% in 2025.
Plans continued to pay out above target, increasing for most sectors year-over-year. While total shareholder return (TSR) itself is rarely a STI metric, these outcomes were broadly consistent with the shareholder experience, as most sectors also delivered strong one-year TSR.
The pattern extends to individual performance. Among the TSX60 companies that disclosed individual multipliers (~40%), one third of multipliers were below 115% (which approximates the average corporate multiplier in recent years) and two-thirds were above 115%. This suggests that individual performance multipliers were once again rated more generously than corporate performance.
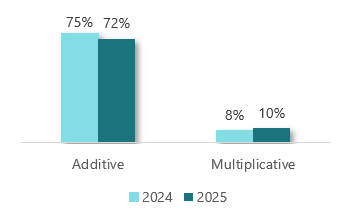
Additive plans remained the clear market standard. Six companies (up from five) used multiplicative structures; an approach worth watching, though not a broad shift.
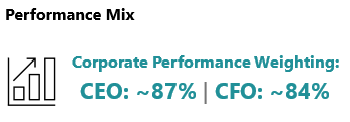
Corporate performance was weighted on average at ~87% for CEOs and ~84% for CFOs, broadly steady year-over-year. There was no change for CFOs and the corporate weighting for CEO moved slightly for a handful of companies, including: Barrick moved to fully corporate in 2025 (Fortis follows in 2026), while CN Rail went the other way, reintroducing an individual component "to strengthen accountability and encourage discretionary effort."
Performance Metric Composition
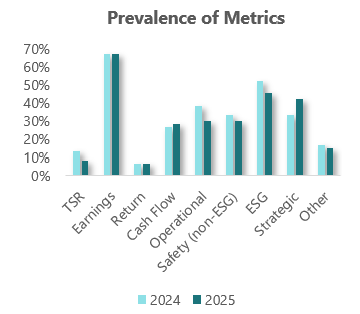
Performance metric composition stayed relatively consistent year-over-year. Financial measures continued to anchor most scorecards, led by earnings. Non-financial metrics – operational, safety, strategic and ESG (environmental, social and governance) factors – made up roughly a third of the overall scorecard. Despite a decrease in prevalence of ESG measures to ~45% of plans in 2025 (vs. ~52% in 2024), the average weighting remaining steady at ~12% (vs. ~11% in 2024). Other metrics followed a similar pattern, with average weighting staying relatively consistent despite an increase or decrease in prevalence.
The average number of metrics stayed constant year-over-year at ~5, ranging from a single metric to 20 metrics in total. Out of those that disclosed metrics, ~75% of issuers used 7 metrics or less.
Trends to Watch
Beyond the headline numbers, this year's analysis revealed several emerging STI design trends. While some are well established, others are still taking shape and will be important to monitor as practices continue to evolve.
Using Incentives to Accelerate Strategic Execution
Canadian Tire introduced the 2025 Transformational STI plan tied to the achievement of specific, measurable milestones associated with the 2025–2028 strategic priorities. This one-time incentive program is in addition to the current STI plan.
In 2025, Restaurant Brands International added a 20% modifier for the CEO, CFO and General Counsel tied to the outcome of efforts to find a suitable joint venture partner for their Burger King China business.
Hydro One increased the weighting on reliability and enhanced its productivity measure to include corporate transformational savings initiatives to promote a culture of productivity, efficiency and transformation.
This marks a potential shift toward using incentive design as a tool to drive specific strategic outcomes. Rather than relying solely on traditional annual incentive plans, companies are increasingly incorporating targeted modifiers, introducing standalone incentives, and adopting other bespoke mechanisms to place greater emphasis on high-priority transformation initiatives.
Customer Experience (CX) Metrics Continue to Evolve
In 2024, there were 15 companies that used CX metrics within their STI plans. Prevalence stayed steady with 16 companies in 2025. Notable changes to customer experience metrics include:
For 2026, Hydro One is “changing how we measure our success in meeting our customers' expectations by replacing overall favourable impression with overall customer satisfaction and overall brand impression as they better reflect our broader customer segment.”
In 2025, CN Rail replaced Net Promoter Score with Customer Satisfaction Index, “which measures customer sentiment related to CN’s communication and overall ease of doing business.”
In 2025, Loblaw “refined its pursuit measures by introducing a robust customer scorecard in addition to the ESG metrics. The customer scorecard enables a more balanced approach to sales and profit growth by focusing on market share in food and drug, weekly engaged users of the PC Optimum program, and sales growth in categories that drive customer lifetime value.” The scorecard is weighted at 20%.
Circuit Breakers are Increasing in Prevalence
Historically, the use of circuit breakers has been a minority practice among the TSX60, but we saw a noticeable increase in its use (or at least in disclosure). This year, nine TSX60 companies included a circuit breaker within their STI plan, up from four in 2024. Circuit breakers are most often based on earnings or cash flow metrics.
We expect that companies are increasingly building explicit downside guardrails into annual incentive plans to ensure that STI payouts have a strong alignment to shareholder value creation.
Looking Ahead
While 2025 did not bring sweeping changes, STI design continues to evolve through incremental refinements. Organizations are adjusting performance metrics to better reflect changing business realities, strengthening payout governance, and selectively introducing new design features. Looking ahead, we expect continued innovation as companies seek to balance pay-for-performance with an ever evolving landscape of what truly matters going forward.
Stay tuned for more TSX60 executive compensation insights in the coming weeks.
For more information or to sign up for our newsletters, contact us at info@laulimaconsulting.com.
For more information on incentive market practice and trends, or to participate in Laulima’s Annual Incentive Design Survey, contact us at surveys@laulimaconsulting.com.
Follow us on LinkedIn.
Lire plus d'articles
VOIR TOUT


.svg)


Dropdown