August 17, 2026

TSX60 Series
TSX60 Research - Long-Term Incentive Plans
How Long-Term Incentives Evolved in 2025: Refining Rather Than Reinventing. Across the TSX60, long-term incentives typically represent two-thirds of an executive’s total direct compensation. In 2025, LTI design remained broadly stable as companies continued to refine vehicle mix and performance measures.
Download the article here

Download the article here

How Long-Term Incentives Evolved in 2025: Refining Rather Than Reinventing
Written By: Danny Qiao
Contributors: Luc Lapalme
Across the TSX60, long-term incentives typically represent two-thirds of an executive’s total direct compensation. In 2025, long-term incentive plan design remained broadly stable; companies continued to refine vehicle mix and performance measures. Performance share units remained the dominant vehicle, and performance multipliers for periods ending in 2025 averaged 106%, which is almost 10 percentage points higher than 2024 and similar to the trend we saw for short-term incentives.
Continuing Laulima’s TSX60 Series, this article draws on disclosed 2025 compensation from TSX60 companies to examine how long-term incentives paid out, how metrics are evolving, and how a few companies are using special plans to drive specific outcomes.
Year-Over-Year Snapshot – How Long-Term Incentive (LTI) Plans Changed in 2025
TSX60 LTI at a Glance
Average CEO LTI as % of Target TDC:
67% → 67%
No Change
Average # of LTI Vehicles:
2.0 → 2.0
No Change
Average PSU Performance Multiplier:
97% → 106%
+9 pts YoY
Average # of PSU Performance Metrics:
2.3 → 2.3
No Change
Most Prevalent PSU Performance Metric: Relative TSR:
73% → 74%
+1 pt YoY
Performance Share Unit (PSU) Outcomes
As the dominant LTI vehicle across the TSX60, performance share units (PSUs) provide a useful lens through which to examine how long-term incentives performed for periods ending in 2025.

Average PSU performance multipliers increased across the TSX60 in 2025, rising from 97% in 2024 to 106% in 2025. Energy and Financials led all sectors, with average multipliers of 121% and 118%, respectively, while Materials remained below target at 82%. Materials stood apart despite recording the strongest 3-year TSR of the sectors shown, as several companies faced poor safety and operational challenges. Since total shareholder return (TSR) was not the sole – and in several cases not the most heavily weighted – performance measure, these factors contributed to the below-target outcome for Materials.
In most cases, the increase in PSU performance multipliers occurred alongside strong TSR for the most recent three years. If we apply each company’s performance multiplier to its 3-year cumulative TSR, we estimate PSU payouts generally exceeded target grant value by ~50% at the median.
LTI Mix
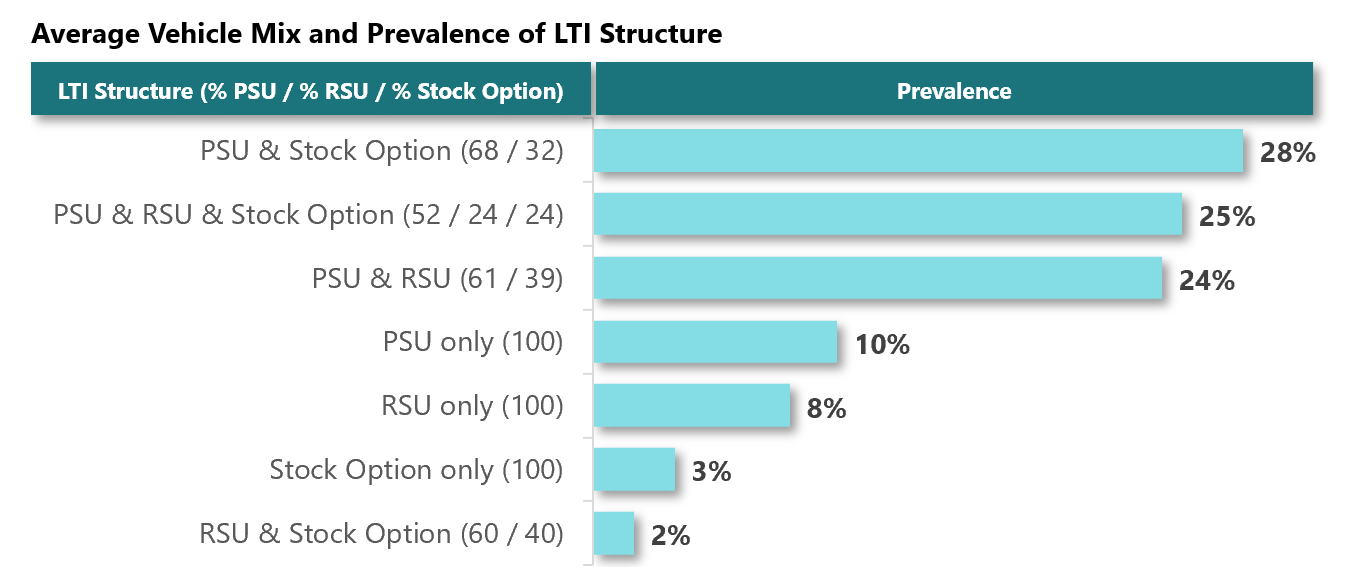
Across the TSX60, companies typically combine multiple vehicles within a single structure. In 2025, 54% of companies used two LTI vehicles, while 25% used three vehicles; only 21% relied on a single vehicle. PSUs remained the most widely used vehicle, included in 86% of LTI structures and made up at least half of total LTI in 98% of companies.
Number of PSU Performance Metrics
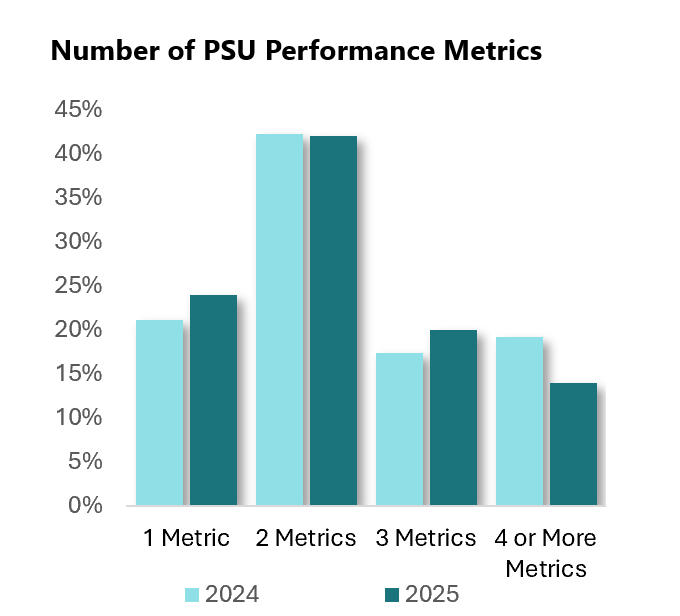
TSX60 companies typically use a focused set of performance metrics within their PSU plans, with most using two metrics. Year-over-year, the average number of metrics remained unchanged at 2.3 metrics.
PSU Performance Metric Prevalence
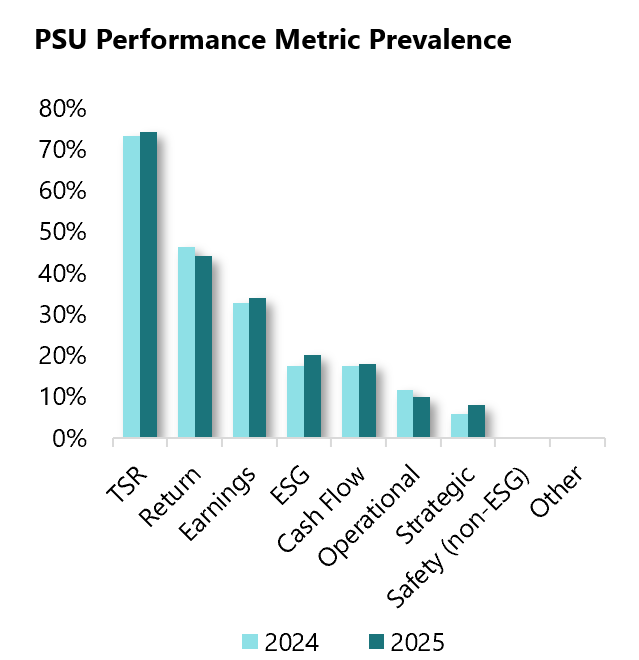
Relative TSR remained the most prevalent PSU performance metric in 2025, used by 74% of companies, followed by return and earnings measures at 44% and 34%, respectively. The prevalence of ESG (environmental, social and governance) measures remained similar at 20%.
STI vs PSU Performance Metric Prevalence
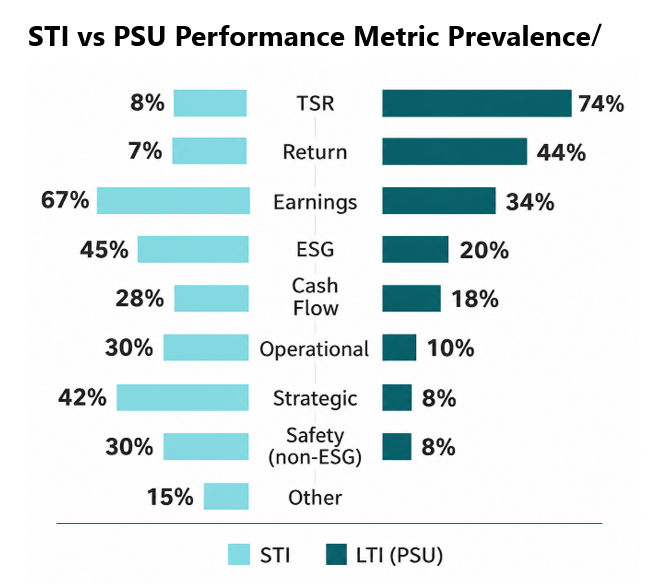
Whereas measures such as TSR and return feature more prominently in PSU plans, short-term incentive (STI) scorecards place greater emphasis on financial, ESG and strategic measures. This distinction allows the two plans to complement one another, with STI rewarding annual performance and LTI reinforcing longer-term value creation, rather than measuring the same performance across both plans.
PSU Threshold & Maximum Award Levels
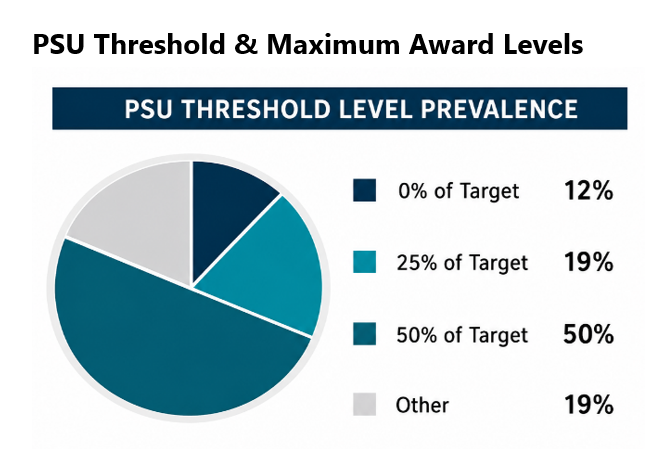
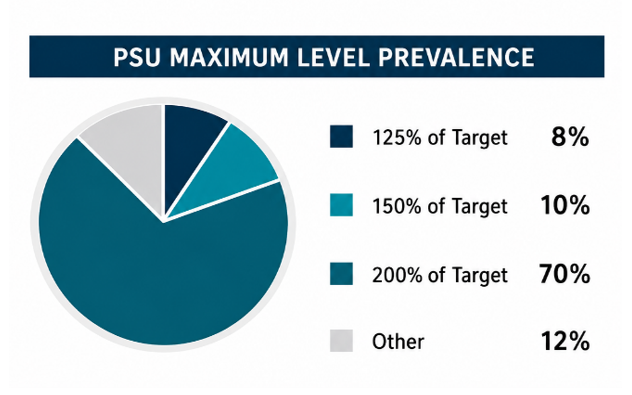
PSU plans provide a range of outcomes based on performance against established targets. The most prevalent threshold payout is 50% of target, used by half of the TSX60 companies. Performance below threshold generally results in no payout for that performance measure.
Maximum payout levels are more consistent across the TSX60, with 70% of companies capping PSU payouts at 200% of target.
Notable LTI Changes in 2025
Refining LTI Mix and PSU Metrics
BCE
Contrary to what most companies did in recent years, BCE reintroduced stock option to place greater emphasis on share price growth. The CEO's LTI is comprised of 50% PSU and 50% stock option, replacing the previous 50% PSU and 50% RSU mix. BCE also revised its PSU performance measures, with Free Cash Flow and Net Debt to Adjusted EBITDA each weighted at 50%, while Relative TSR was converted from a standalone performance metric to a ±25% modifier.
Canadian Tire
Canadian Tire redesigned its LTI as part of its True North transformation strategy, introducing RSU to the executive mix and reducing the emphasis on stock option. The 2026 LTI mix is comprised of 60% PSU, 20% RSU and 20% stock option, compared with 60% PSU and 40% stock option previously. PSU performance measures were also revised, with relative TSR and loyalty penetration each weighted at 50%, replacing the previous ROIC, EPS and loyalty measures. The maximum PSU payout was reduced from 200% to 175%, with a 25% payout floor introduced.
CN Rail
CN Rail introduced RSU alongside PSU and stock option. The revised mix shifts away from the previous 70% PSU and 30% stock option structure, with PSU now representing 60% of the total. For the CEO, the remaining 40% comprises 30% stock option and 10% RSU, while NEOs receive 20% of each.
Hydro One
Hydro One introduced a greater retention component while maintaining a strong performance focus. For senior executives, the LTI mix shifted from 100% PSU to 75% PSU and 25% RSU. The company also reduced the PSU performance period from four to three years.
Using One-Time LTI Awards Selectively
While LTI design remained broadly stable, a few TSX60 companies used one-time LTI awards selectively to address specific strategic priorities (e.g., transformation, retention). The examples below illustrate how one-time awards can complement, rather than replace, the core LTI program.
Canadian Tire
Canadian Tire introduced a one-time 2026 Transformation LTI award, consisting of a performance-based PSU award that vests after three years and is tied to profitability targets and relative TSR performance. This award was separate from CTC’s regular annual LTIP, which was also redesigned for 2026. Notwithstanding this special award, Canadian Tire had 95% support for its say on pay vote in 2026.
Intact Financial
Intact Financial granted its CEO a special, one-time performance stock option award in 2025 to support retention beyond the vesting period of a previous award and reinforce alignment with long-term shareholder value creation. The award contributed to a 65% year-over-year increase in disclosed CEO pay and drew shareholder and proxy advisor concerns about pay-for-performance alignment, contributing to only a 53% support for the say-on-pay vote in 2026.
Looking Ahead
TSX60 companies did not experience a wholesale change in LTI design in 2025. Instead, companies fine-tuned their established programs through targeted changes to vehicle mix, performance measures, vesting and award mechanics. The focus is on refining rather than reinventing LTI.
For more information or to sign up for our newsletters, contact us at info@laulimaconsulting.com.
For more information on incentive market practice and trends, or to participate in Laulima’s Annual Incentive Design Survey, contact us at surveys@laulimaconsulting.com.
Follow us on LinkedIn.
Lire plus d'articles
VOIR TOUT



.svg)


Dropdown