August 15, 2024

TSX60 Series
TSX60 Key Executive Compensation Observations - A Deeper Dive Into Long Term Incentive Plans
LTI is the largest component of executive pay, with increasingly more emphasis on the use of Performance Share Units. The most prevalent combination of performance metrics is comprised of Relative TSR and absolute financial performance. Stock options continue to decline in prevalence, with companies recently eliminating or reducing the weighting on stock options. RSUs continue to make up 20-25% of total LTI. Download Laulima's complimentary report on TSX60 Long-Term Incentive Plans to learn more.
Download Laulima's article here

Download Laulima's article here

TSX60 Key Executive Compensation Observations
A Deeper Dive into Long-Term Incentive Plans (LTIPs)
Continuing Laulima’s series on TSX60 executive compensation, this article delves deeper into Long-Term Incentive Plans (LTI plans or LTIPs). Laulima’s key findings¹ reveal:
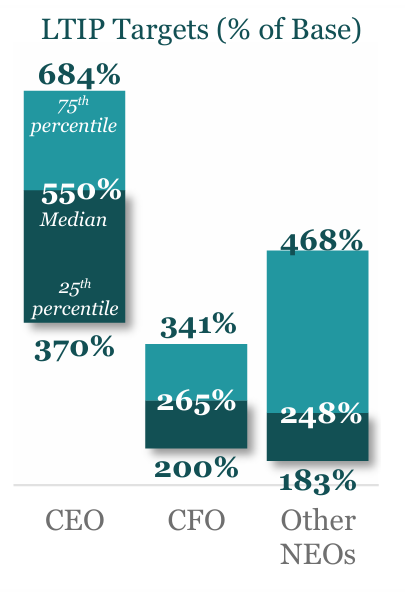
- Approximately 60% of CEOs’ and 50% of NEOs’ total direct compensation (TDC) among TSX60 companies is comprised of LTI, with median targets of 550% of base salary for CEOs and approximately 250% for other NEOs.
- Median LTIP targets are 2.8x to 3.8x median STI targets.
- PSUs are the most common LTI vehicle, with approximately 75% of companies combining them with stock options, RSUs or all three vehicles.
- Most PSU plans cliff vest after 3 years based on performance on two metrics. The most prevalent combination is relative TSR and absolute financial performance.
- Stock options continue to decline in prevalence, with at least 5 TSX60 companies eliminating or reducing the weighting on stock options in 2023 or beginning in 2024.
- RSUs continue to make up 20–25% of total LTI. Virtually all RSUs vest at the end of a 3-year period, with either cliff vesting (two-thirds of companies) or ratable vesting (one-third of companies).
The remainder of this article highlights Laulima’s key insights into TSX60 LTI plans.
Targets
- As noted in Laulima’s article on year-over-year compensation changes, CEOs and NEOs continue to see approximately 60% and 50% of their TDC in LTI, respectively.
- Median LTIP targets are 550% of base salary for CEOs, 265% of base salary for CFOs, and approximately 250% of base salary for other NEOs.
- Median LTIP targets are now 2.8x to 3.8x median STI targets, meaning most incentives are tied to long-term performance.
- The Financials sector places a notably greater emphasis on LTIP than other sectors. Median LTIP targets as a percentage of base salary are near the 75th percentile.
LTI Mix
- PSUs are the most commonly used LTI vehicle, followed by RSUs and stock options.
- The majority of TSX60 companies use a combination of two LTI vehicles.
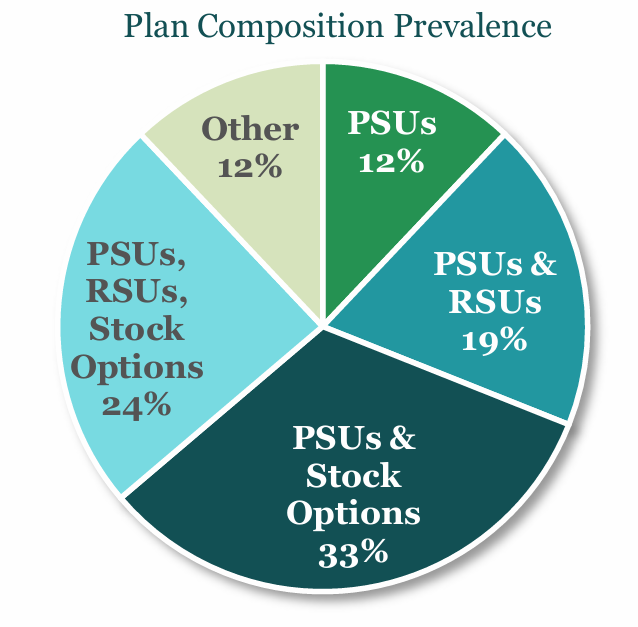
- The most widely used combinations² are:
- PSUs and stock options (33% prevalence)
- PSUs, RSUs, and stock options (24% prevalence)
- PSUs and RSUs (19% prevalence)
- Companies continue to monitor their LTI mix to ensure it meets compensation objectives while considering evolving shareholder expectations for more performance-based compensation and the recent changes to option taxation in Canada.
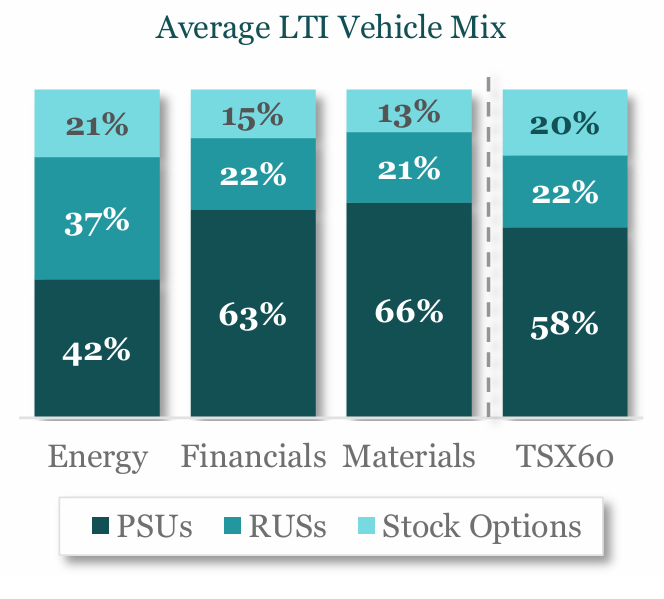
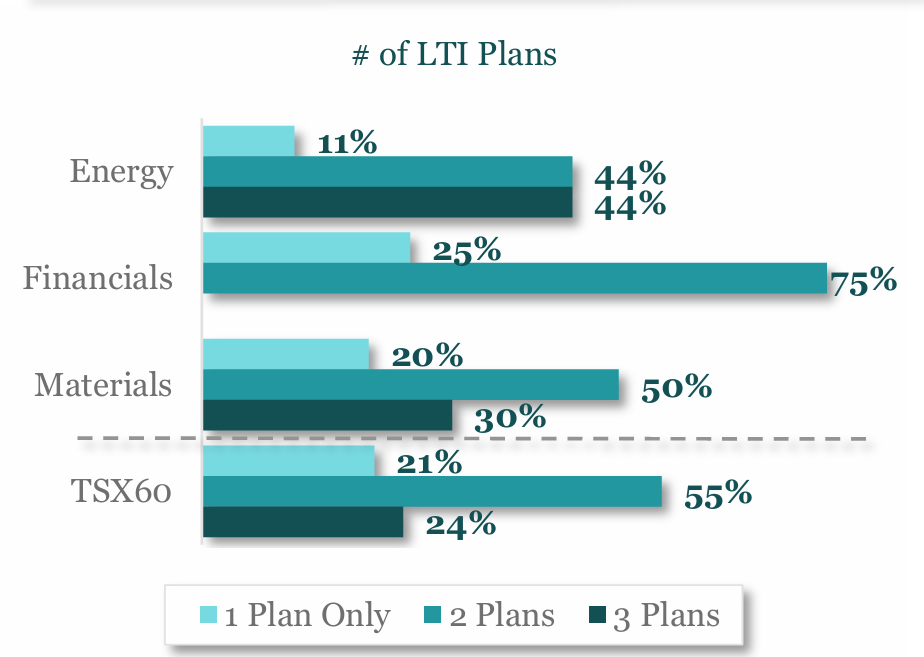
We anticipate that the emphasis on PSUs will continue to increase going forward, albeit at a more gradual pace since PSUs are already virtually ubiquitous and the highest-weighted vehicle among TSX60 issuers.


PSUs
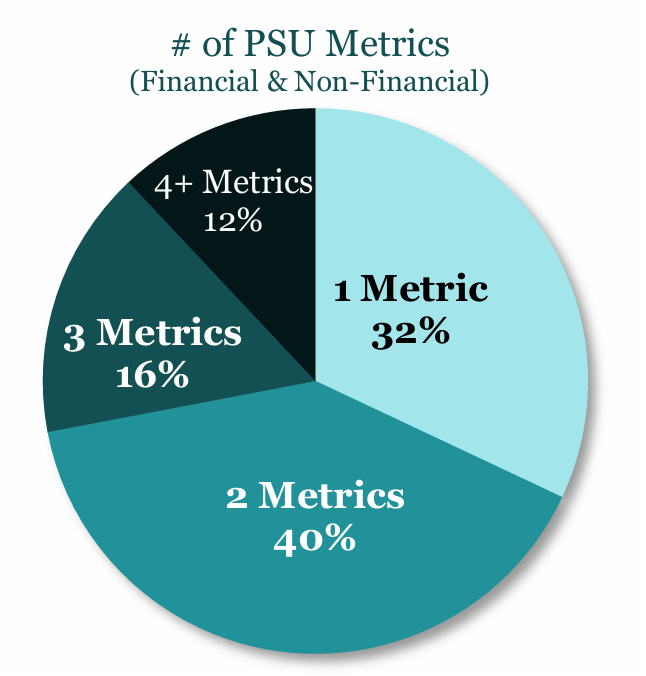
- Most PSU plans vest based on the achievement of two performance metrics although approximately one-third of companies continue to use a single performance metric. This differs from STI plans where the median number of metrics is five. Fewer metrics streamline the goal-setting process and tie LTIP payouts to the most critical performance indicators.
- PSUs are most often tied to:
- an external metric (relative TSR); and
- an internal metric (typically absolute financial performance).
- It is no longer common for PSUs to focus exclusively on relative TSR.
- Consistent with STI, most companies set payouts at:
- 50% for threshold performance;
- 100% for target performance; and
- 200% for maximum performance.
- The vast majority of PSU plans measure long-term sustainable performance over a three-year period as opposed to measuring performance against annual objectives.
Common Performance Metrics
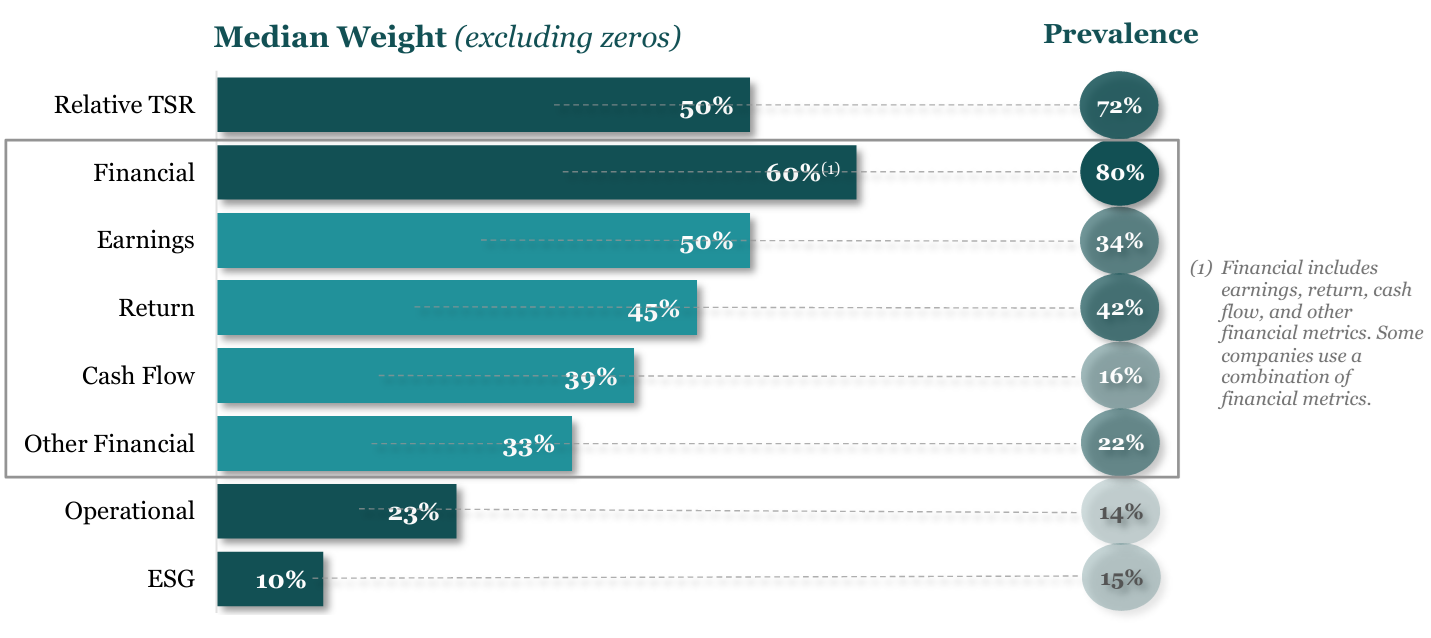
- Relative TSR is used by almost three-quarters of companies. Where used, companies tend to compare TSR performance to a custom performance peer group³ using percentile rank.
- Threshold performance is usually set at or near the 25th percentile.
- Almost all companies set target performance at the median.
- 60% of companies set maximum vesting at the 75th percentile while the remaining 40% set maximum between the 80th and 90th percentiles.
- The remaining companies measure relative TSR performance using an index or a combination of index and peers.
- Financial performance is used by 80% of companies. Where used, metrics are most often assessed on an absolute basis — that is, companies measure success based on whether performance falls within a predetermined performance range.
- Some PSU plans (14%) incorporate a performance modifier that can vary payouts by up to +/-20% of the initial performance multiplier.
- The most common metrics used as a modifier are relative TSR and ESG.
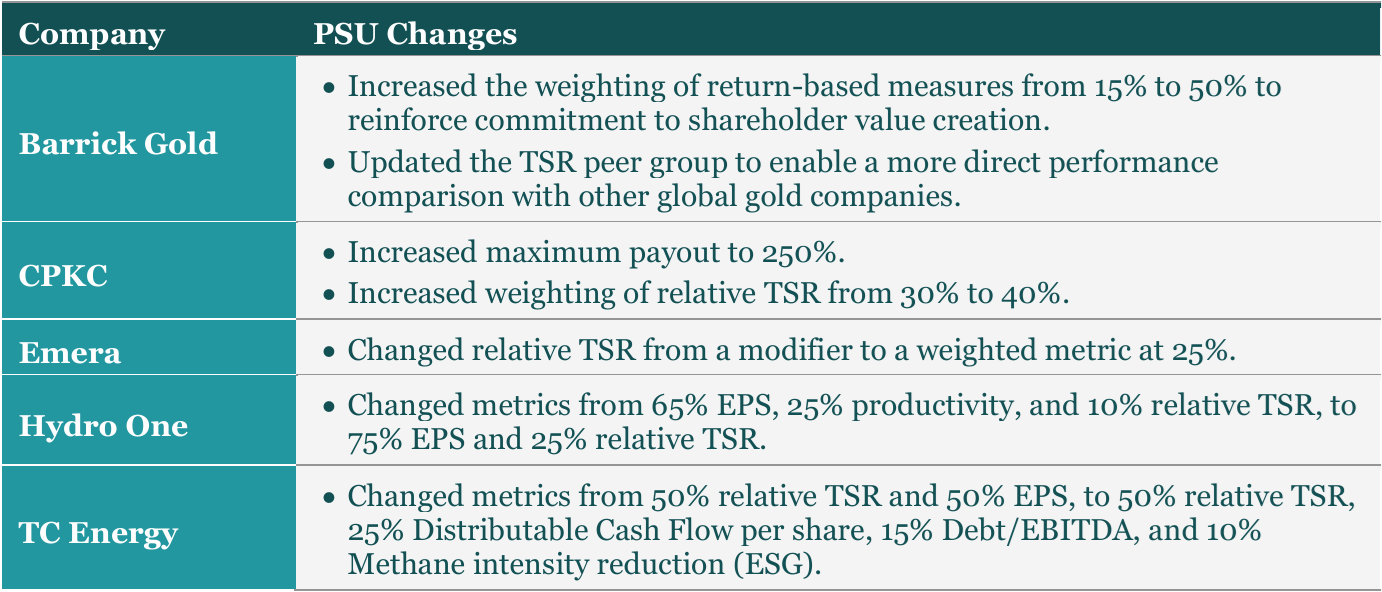
There have not been any significant changes to PSU design in 2023/2024. The above represent the more notable observations.
Stock Options
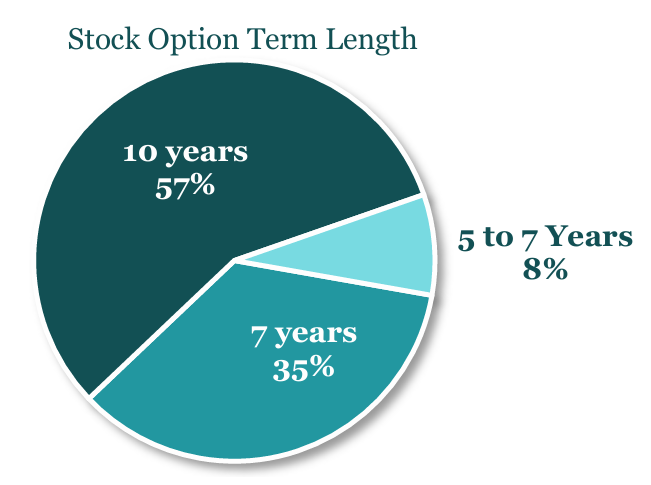
- Most stock options have a 7- or 10-year term and completely vest after 3 to 5 years.
- Performance-based vesting is rare.
- FirstService uses a combination of:
- time-based stock options that vest over 4 years; and
- performance-based options that vest upon achieving specific financial hurdles.

Restricted Share Units (RSUs)
- Similar to PSUs, RSUs most typically vest at the end of a three-year period, but are subject to time restrictions only (instead of time and performance).
- RSUs cliff vest at the end of 3 years for approximately two-thirds of companies, whereas the balance apply ratable vesting.
While companies should continually monitor evolutions and best practices in LTIP design, it is important not to get caught in a one-size-fits-all approach. Companies should carefully assess their LTIP to ensure a strong linkage to their own strategic imperatives that drive long-term shareholder value creation. Rigorous stress-testing and regular pay-for-performance analyses can help ensure the LTIP is working as intended and that payouts are commensurate with long-term company performance.
For more information, contact us at info@laulimaconsulting.com.
¹ Based on Laulima’s review of recent TSX60 proxy disclosures.
² Percentages based on prevalence among TSX60 issuers reviewed.
³ Custom peer groups typically consist of companies selected for performance comparison purposes rather than compensation benchmarking.
Lire plus d'articles
VOIR TOUT






.svg)


Dropdown