TSX60 Series

TSX60 Key Executive Compensation Observations
Modest CEO salary increases, notably larger long-term incentive (LTI) awards, the majority of companies paying executives bonuses above target, and a continued trend towards greater emphasis on performance share units (PSUs). Find out more by downloading Laulima's complimentary report on TSX60 Executive Compensation Key Findings.
Download Laulima's article here

Download Laulima's article here

TSX60 Key Executive Compensation Observations
June 2024: Key Insights
The 2023 executive compensation landscape¹ within the TSX60 companies reveals several key observations across major sectors. Most notably, Laulima's findings suggest:
- Modest CEO salary increases and notably larger long-term incentive (LTI) awards.
- Short-term incentive (STI) payout results are similar to prior years, with the majority of companies paying above target.
- A continued trend towards greater emphasis on performance share units (PSUs).
This article highlights key insights into base salary and total direct compensation (TDC) year-over-year increases, STI payouts, pay mix and LTI mix.
Base Salaries
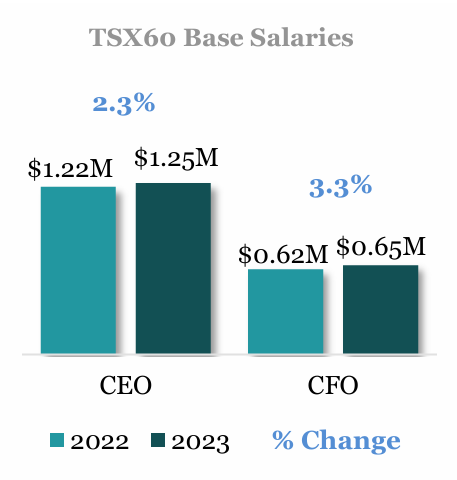
- Median base salaries increased by 2.3% and 3.3% for CEOs and CFOs, respectively. For same-incumbent CEOs and CFOs, median increases were 2.9% and 4.2%, respectively.
- Salaries were held flat for more CEOs (36% of companies) than CFOs (16%). Excluding zeroes, the median increase for same-incumbent CEOs and CFOs was 4.8%.
- The largest median increase for same-incumbent CEOs was seen within the Energy sector (6.7%), while salaries were held flat for most CEOs in the Financials sector.
Total Direct Compensation (TDC)
- Median TDC increased by 8.1% and 1.5% for CEOs and CFOs, respectively. For same-incumbent CEOs and CFOs, median increases were 6.3% and 6.6%, respectively.
- The increase in median TDC resulted from a combination of base salary increases and larger LTI awards in 2023. STI payouts remained relatively flat year-over-year.
- The Energy sector saw the largest same-incumbent increases for both the CEO and CFO (15.3% and 11.4%, respectively), primarily because of larger LTI awards.

Short-Term Incentive (STI) Payout
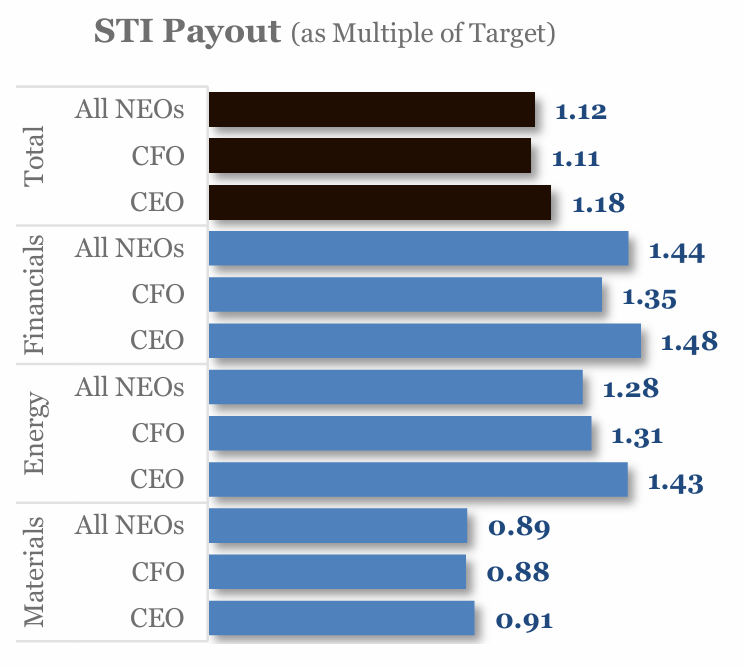
- STI payouts were slightly above target (1.12x) in aggregate across all industries.
- Favourable payouts in the Energy (1.28x) and Financials (1.44x) sectors were driven by positive industry and company performance.
- Payouts in the Materials sector (0.89x) were below target due to recent regulatory changes in their operating environment. Fatalities and missed financial thresholds also marred payouts for some companies in the sector.
Target Pay Mix
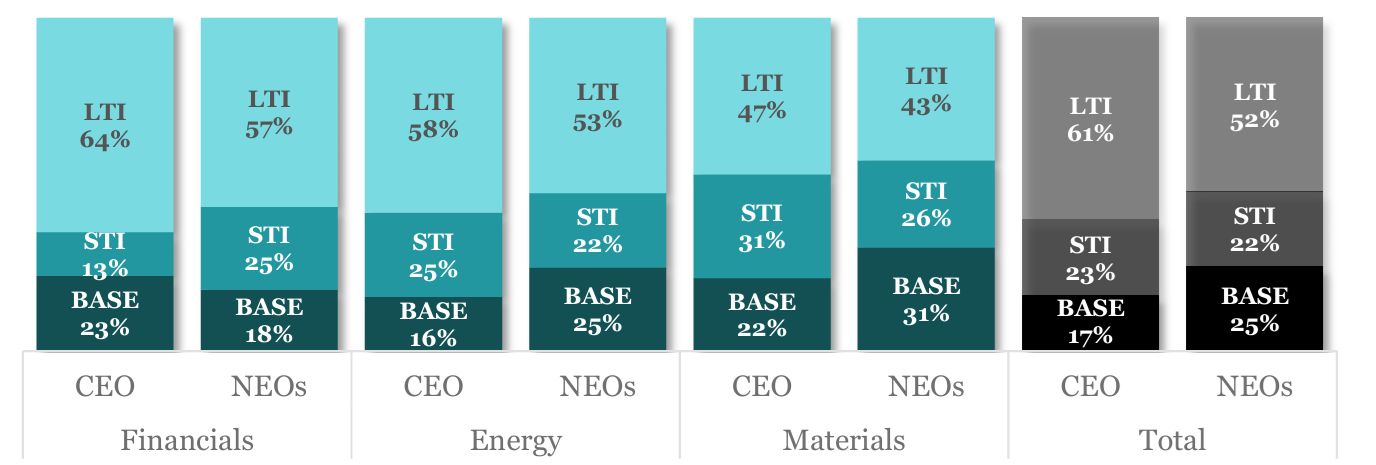
- On average, CEOs and other NEOs continue to see approximately 60% and 50% of their TDC in LTI, respectively.
- The highest weighting on LTI is seen in the Financials sector, while the lowest is seen in the Materials sector where there is a greater emphasis on cash compensation.
- On a year-over-year basis, there has been a slight increase (~2%) in the relative weighting of LTI across industries.
Long-Term Incentive (LTI) Mix
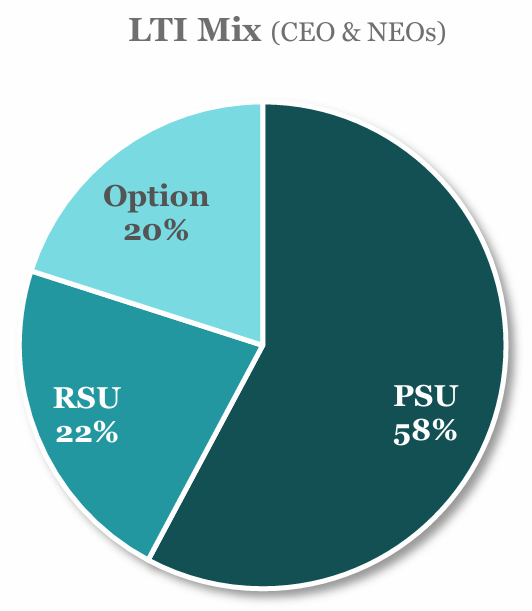
- The majority of companies use at least two LTI vehicles (60%) and the average weighting of PSUs in the mix continues to increase.
- While it remains most common to deliver LTI using a combination of PSUs and stock options (28%), it is also fairly common (22%) to use three vehicles (PSUs, RSUs and stock options).
- We expect companies to monitor their LTI mix to ensure that it continues to meet their compensation objectives, while considering evolving shareholder expectations and the pending changes to option taxation in Canada.
Stay tuned for more TSX60 executive compensation insights in the coming weeks.
For more information, contact us at info@laulimaconsulting.com.
¹ Data sample reflects 2022 and 2023 public disclosures as of July 10, 2024.
Read more articles
SEE ALL





.svg)


Dropdown