September 19, 2025

TSX60 Series
TSX60 - Executive Pay Insights - Stable & Evolving
The 2024 TSX60 compensation season highlights a landscape of stability with signs of continued evolution. Shareholder support for Say-on-Pay remained robust, while boards fine-tuned pay practices through modest salary growth, heavier reliance on LTIs, and careful use of discretion. ESG measures continued to gain ground, signaling that executive pay design is entering a new phase of balance between performance, sustainability, and accountability.
Download Laulima's article here

Download Laulima's article here

TOPIC: EXECUTIVE COMPENSATION
TSX60 Research Executive Pay Insights – Stable & Evolving
The 2024 TSX60 compensation season highlights a landscape of stability with signs of continued evolution. Shareholder support for Say-on-Pay remained robust, while boards fine-tuned pay practices through modest salary growth, heavier reliance on LTIs, and careful use of discretion. ESG measures continued to gain ground, signaling that executive pay design is entering a new phase of balance between performance, sustainability, and accountability.
The 2024 TSX60 compensation landscape remained stable but evolving. Shareholder approval of Say-on-Pay (SOP) remained high, with only isolated challenges. Median CEO salaries rose modestly, while total direct compensation growth was driven largely by increases in long-term incentives (LTI). Short-term incentive (STI) payouts continued to come in slightly above target, with increasing reliance on company-wide scorecards and a simplified set of performance metrics to emphasize enterprise-wide results.
1) See Laulima’s article on Managing Executive Pay in a Changing Economic Climate.
Macroeconomic and Governance Context
Management and Boards operated against a backdrop of volatile global trade and currency pressures that complicated setting and delivering on performance targets. Canadian issuers continued to face upward pressure on compensation1, while investors demanded stronger pay-for-performance alignment and enhanced ESG integration in incentive plans.
Say-on-Pay and Shareholder Sentiment
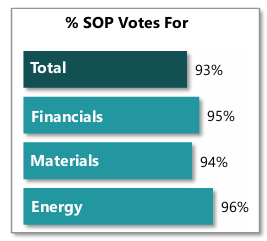
SOP support remained strong in 2025, averaging 93%, with all but one company that have reported SOP results receiving more than 80% support (Shopify received 62% FOR).
Energy sector issuers had the highest support (96%), followed by Financials (95%). Materials support rose to 94%, up from 91% last year, reflecting improved investor confidence in executive pay and governance.
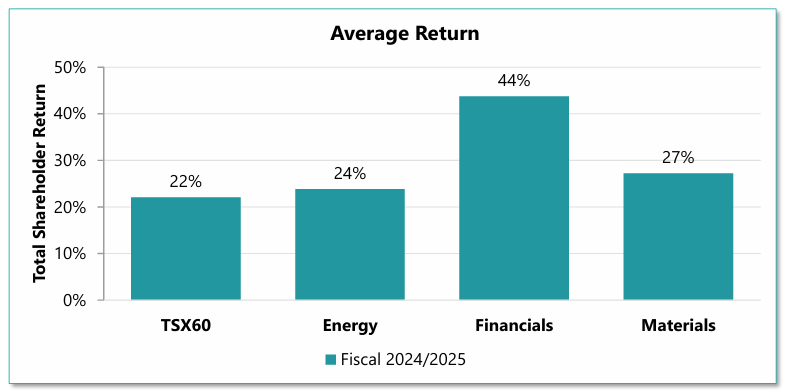
The strong support came against a backdrop of robust shareholder returns. TSX60 companies delivered an average return of 22%, with especially strong performance in Financials (44%), Materials (27%) and Energy (24%). These returns likely reinforced investor confidence that pay outcomes were aligned with performance.
CEO and CFO Pay Levels in 2024
Among all TSX60 constituents, median CEO base salary increased 5% to $1.31M, while CFO base salary grew 13% to $0.74M.
Target total direct compensation (TTDC²) rose 8% for CEOs and 11% for CFOs, but actual TDC (ATDC³) growth was lower at 2% for CEOs and 9% for CFOs.
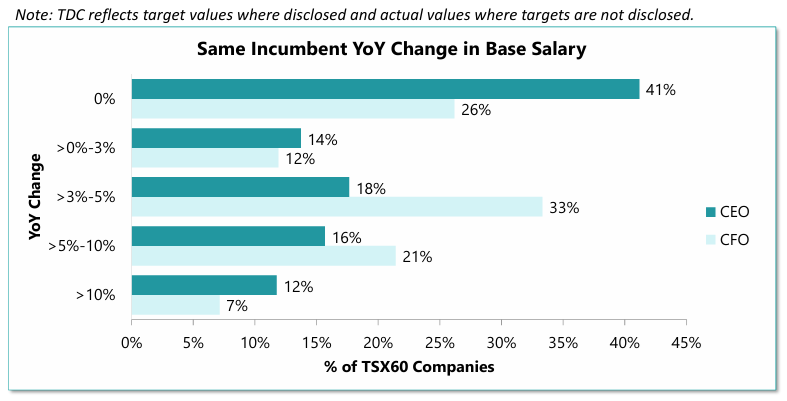
When reviewing year-over-year compensation for the same incumbent, the median increase for CEOs was 1.6%, with 41% receiving no change in base salary and approximately 28% received at least a 5% increase.

2) TTDC includes target STI and target LTI.
3) ATDC includes actual STI payouts for 2024 performance and actual LTI grant amounts made in fiscal year 2024.
By contrast, the median increase for the same incumbent CFOs was 3.5%, with 33% receiving 3%–5% increases and another 28% receiving at least a 5% increase.
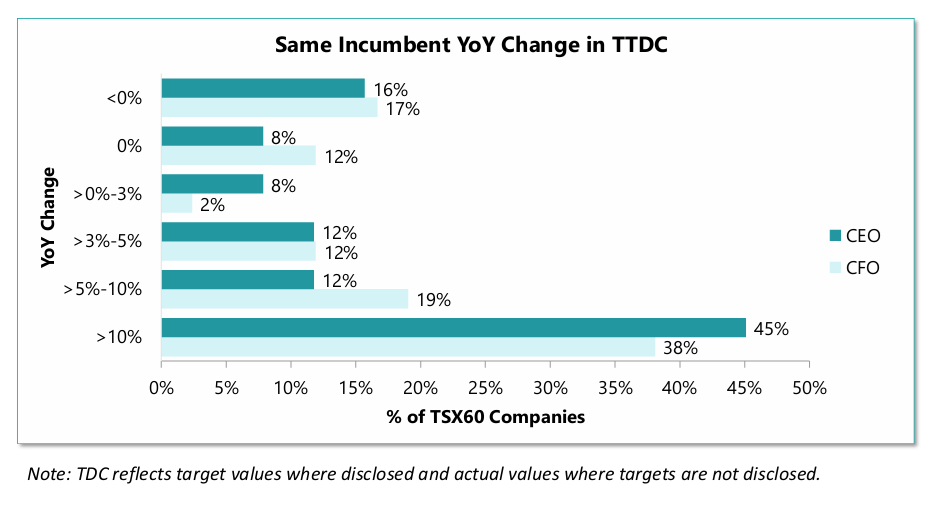
Across the same incumbents, more than half received at least a 5% increase in TTDC. Approximately 45% of CEOs and 38% of CFOs saw a double-digit increase in TTDC. Median change was 7.8% for CEOs and 7.2% for CFOs.
Average weighting on LTI in the TTDC mix continued to increase on a year-over-year basis, up from 61% to 67% for CEOs last year across all TSX60 constituents. Energy and Materials sectors drove the largest LTI increases, while Financials remained stable. For CFOs, pay mix is similar to last year.
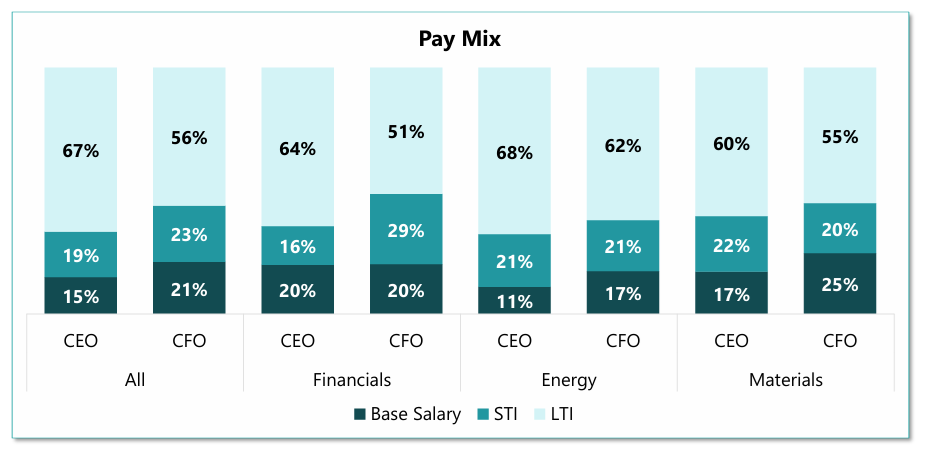
Compensation continued to outpace inflation, underscoring that Boards were prioritizing retention and competitiveness. Greater reliance on LTIs underscores the desire to limit increase in cash compensation and preference for longer term performance and shareholder alignment.
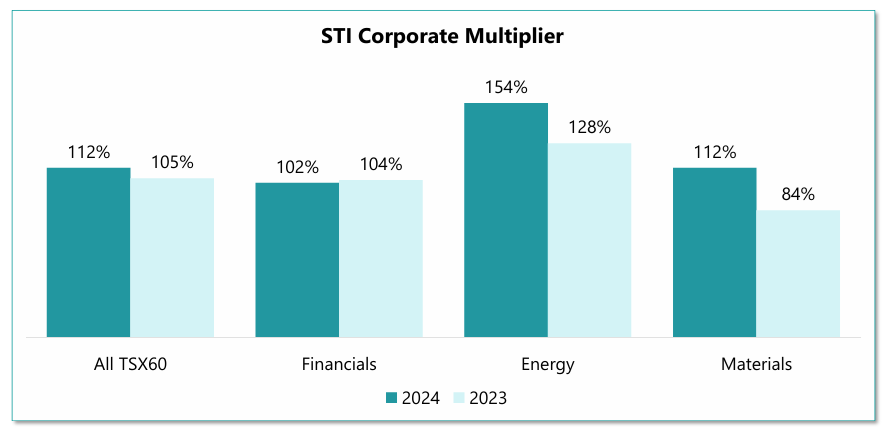
Short-Term Incentives The average STI corporate multiplier for the 2024 performance year was 112% of target, slightly above the prior year’s 105%. The Financials, Energy, and Materials sectors all had above target average multipliers. The Energy sector had a notably higher average multiplier at 154% of target, while the Materials sector rebounded from below target in 2023 to a 112% multiplier.
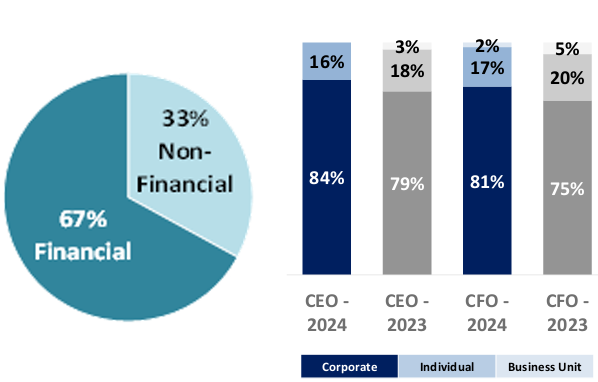
In 2024, there were no significant changes in STI program design among TSX60 companies, however, we observed that the weighting allocated to Corporate performance metrics rose to 84% for CEOs and 81% for CFOs.
There remained a balance between financial and non-financial metrics within STI plans. The inclusion of ESG factors also remained common, typically with weightings of 10% to 15%.
TC Energy Removed business unit / functional area factors and executive STI was solely based on corporate performance factor.
Enbridge Removed business unit scorecards and moved to one company scorecard shared by all employees as it “streamlines the process of goal setting, measurement and tracking of performance, while increasing alignment, teamwork and collaboration across the organization.”
Suncor Removed business unit scorecards and moved to one corporate-wide scorecard to “further reinforce Suncor’s strategy of clarifying, simplifying, and focusing the organization.”
Barrick Increased corporate weighting to 70% and reduced individual to 30% (from 30% corporate / 70% individual).
Pembina Increased corporate weighting to 80% and reduced individual to 20% for SVPs (from 60% corporate / 40% individual).
The use of Board discretion to adjust STI payouts remained uncommon, but some companies continued to apply discretion when warranted. In 2024, approximately 10% of TSX60 companies exercised discretion on STI results. Notable examples are highlighted below.
--- Shift toward corporate scorecards suggests stronger alignment with enterprise-wide performance. ---
Nutrien Applied a 30% downward adjustment. As a result of three serious incidents that resulted in three employee fatalities, the Committee decided “that the 2024 safety performance be reflected through a discretionary downward adjustment for the Executive Leadership Team of 30% in the 2024 Annual Incentive Payout.”
TD Applied a 25% downward adjustment. The Committee determined that executive members would have a reduction in variable compensation: “of no less than 25% from target (i.e. a BPF of 75%), which equated to a discretionary negative adjustment of 24.8%, to recognize the overall performance of the bank, including the out of risk appetite performance.”
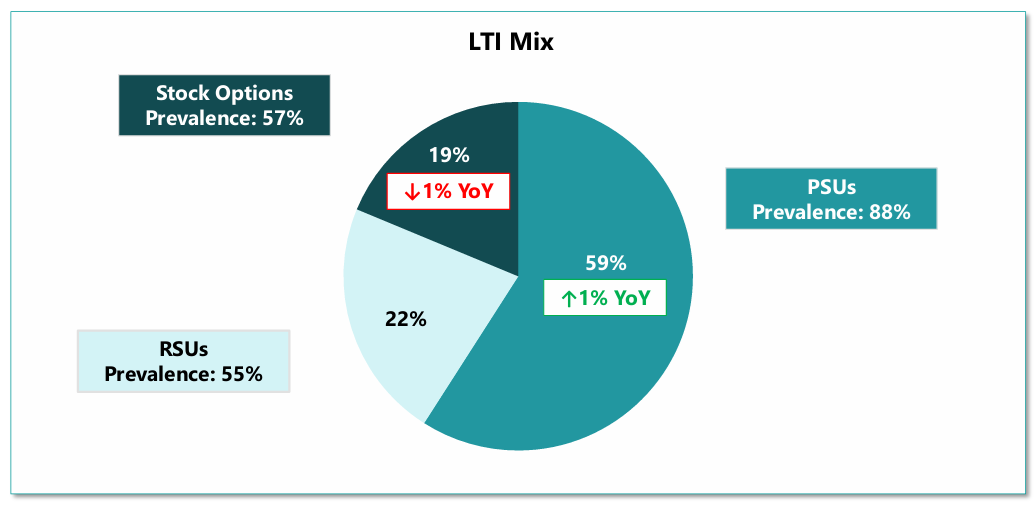
SunLife reduced use of stock options (from 25% stock options / 75% PSUs to 15% stock options / 85% PSUs).
Teck resources Reduced use of stock options and introduced RSUs (from 50% options / 50% PSUs to 25% options / 25% RSUs / 50% PSUs).
Pembina phasing out the use of stock options – reduced weighting in 2024 and removed in 2025 (60% PSUs / 40% RSUs going forward).
CN reduced use of stock options and shifted to PSUs (from 45% options / 55% PSUs to 30% options / 70% PSUs).
WSP and TC Energy both removed stock options and increased PSUs to 70% and RSUs to 30%.
Performance Share Units
Among TSX60 companies, the average PSU payout multiplier for awards ending in 2024 was approximately 97% of target, down from 113% in 2023.
TSX60 companies continued to refine their PSU metrics to balance both internal performance measures and external performance expectations. On average, TSX60 companies used at least two metrics within PSU plans.
ESG and DEI Integration
ESG metrics were embedded in two-thirds of STIs (67%), up from 62% in the prior year.
Environmental and social factors remained the most common, while governance factors were still limited. Median weighting among TSX60 companies was steady at 15%, but several issuers increased their emphasis in 2025. Notable examples are highlighted below.


Canadian Natural Resources ESG weighting up from 15% to 20%; added methane & GHG metrics.
Barrick ESG weighting up from 10% to 15%.
Canadian Apartment Properties REIT new 10% ESG initiatives (employee engagement, ESG plan, GHG investments).
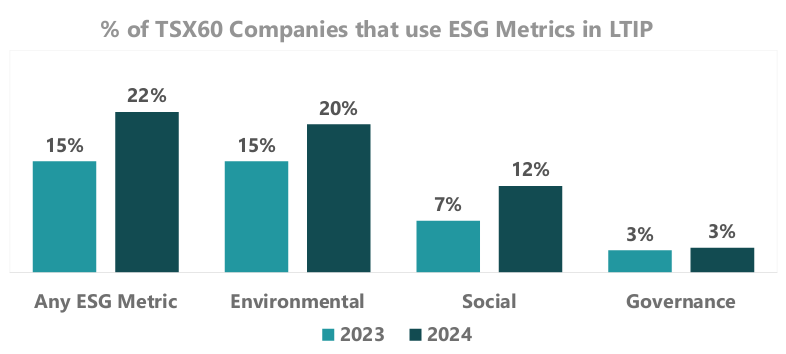
ESG integration into LTIs remained limited but has expanded. In 2024, 22% of TSX60 companies included ESG metrics in PSU scorecards (up from 15%), with the Energy sector leading with 33% prevalence. Of companies that included ESG in their LTI metrics, the typical weighting was 10%.
Climate-related sustainability metrics were gradually appearing in LTIs for energy and resource companies, but adoption remained cautious. In 2024, only a minority of TSX60 issuers embedded such measures directly into PSU scorecards, often at modest weightings or as modifiers rather than core drivers of payout. Notable examples are highlighted below.
Fortis included a carbon reduction achievement metric, weighted at 10% of its PSU design, alongside EPS and TSR. For 2025, Fortis shifted to a new climate-related performance measure that focuses on actions and outcomes that support climate adaptation and mitigation and reduction of GHG.
TC Energy added methane intensity reduction as a 10% PSU metric in 2024, paired with TSR, distributable cash flow, and leverage targets.
Saputo incorporated dual environmental measures – CO₂ reduction and water intensity reduction – accounting for 30% of PSU weight in aggregate.
These additions illustrate how companies are experimenting with climate-linked incentives, but they remain careful not to over-index. Regulatory uncertainty – from shifting Canadian and U.S. climate disclosure requirements to contested emissions targets – makes Boards hesitant to implement aggressive climate goals into three-year PSU cycles.
However, investor and proxy advisor expectations are clear: carbon-intensive issuers, especially in Energy and Utilities, are under pressure to link executive rewards to measurable progress on emissions and sustainability. The likely trajectory is incremental. Climate-related metrics will expand in prevalence across LTIs as companies become more confident in setting robust long-term targets with the benefit of insights from historical data on emissions and sustainability performance, but they are expected to remain modest in weighting until the policy and regulatory environment provides greater stability.
DEI progress continues: 87% of issuers now have Board gender targets, while 42% extended these to the executive team, up from 35%. Disclosure of broader DEI measures beyond gender – including ethnicity, Indigenous representation, and workforce diversity – also increased. Companies also established higher thresholds, with more companies targeting higher female representation on Boards and senior management teams.
Will the use of ESG and DEI in incentive plans continue to expand, or has it reached a plateau?
Outlook for Next Year
The 2024 results point to a compensation environment that is stable but gradually evolving, as Boards continue to fine-tune incentive design.
The end of 2025 may serve as a test: tariffs and other macroeconomic pressures may have varying levels of impacts across sectors, underscoring the importance of resilient, well-calibrated incentive plans. We will continue to monitor this and provide updates.
For more information contact us at info@laulimaconsulting.com.
Read more articles
SEE ALL





.svg)


Dropdown