TSX60 Series

TSX60 Key Executive Compensation Observations - A Deeper Dive into Short Term Incentive Plans (STIP)
Most TSX60 companies use a formulaic annual incentive plan, with financial metrics as key performance drivers. The majority of companies also integrate ESG objectives into their plans. Actual STIP payouts exceeded targets, with individual performance playing a significant role. Download Laulima's complimentary report on TSX60 Short-Term Incentive Plans to learn more.
Download Laulima's article here

Download Laulima's article here

TSX60 Key Executive Compensation Observations
A Deeper Dive into Short Term Incentive Plans (STIP)
As a continuation of Laulima's studies on TSX60 executive compensation, this article delves deeper into Short-Term Incentive Plans (STI plan or STIP). Laulima's key findings¹ reveal:
- Most TSX60 companies deliver annual incentives using a formulaic plan, most commonly via an additive formula.
- The majority of companies cap STIP payouts at 200% of target.
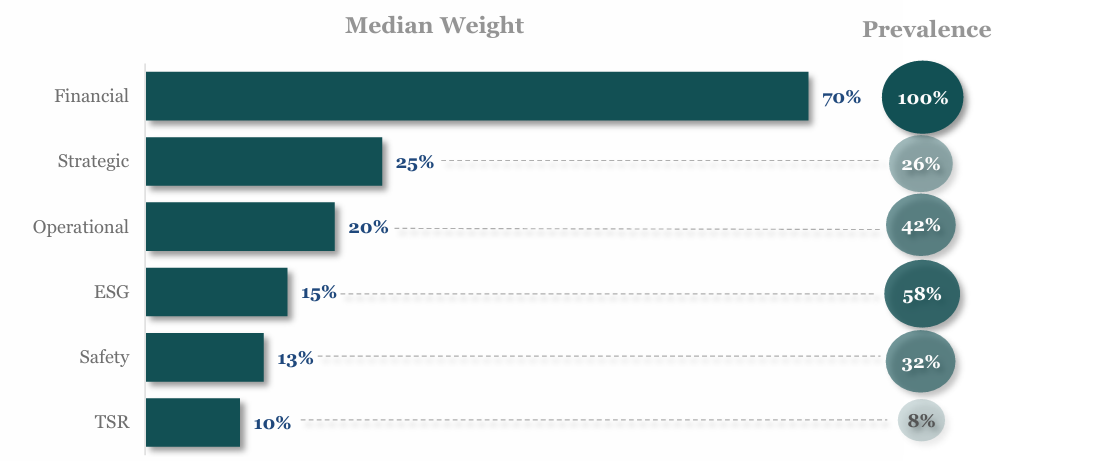
- Financial metrics continue to have the greatest influence on STIP payouts (70% median weighting) with earnings being the most common of these metrics (55% median weighting).
- 2 out of 3 companies include measurable ESG² objectives as a weighted metric, with a median weighting of 15%.
- Actual STIP payouts once again surpassed 100% of target, sitting at 115% at the median. At the median for CEOs/CFOs, the individual performance multiplier (120% of target) is higher than the corporate performance multiplier (106% of target).
- Discretion was applied by 10 companies with formulaic plans to ensure STIP payouts better reflect company performance and alignment with the shareholder experience.
The remainder of this article highlights Laulima's key insights into TSX60 STI plans.
Targets and Leverage
- The majority (92%) of TSX60 companies use a formulaic plan. Remaining 8% deliver STI on a discretionary basis.
- Additive³ plans are the most widely used.
- Median STIP targets are similar across major sectors, with CEO target at 145% of base salary, while CFOs and other Named Executive Officers (NEOs) at 90% of base salary (for companies with formulaic plans that disclose STIP targets).
- Most companies set payouts at 50% of target for meeting threshold performance. 82% of companies cap payouts at 200% of target and the majority of remaining companies apply a cap of 150%.

Notes
¹ Data sample reflects 2022 and 2023 public disclosures as of July 10, 2024.
² ESG (Environmental, Social and Governance) performance metrics that are clearly defined and quantifiable in the STIP. Subjective corporate and individual ESG objectives are excluded. Safety metrics are also excluded.
³ Additive plan reflects the sum of weighted performance multipliers:
STIP Payout = Target STIP × (Corporate Multiplier × Weight + Individual Multiplier × Weight)
Performance Metrics
- In determining STIP payouts, nearly 2 in 3 companies use a mix of corporate and individual objectives for CEOs and CFOs at the median, and 1/3 of companies base CEO/CFO bonuses solely on corporate performance, highlighting their preference for a stronger alignment between STIP payouts and overall company success. Among all companies, median weighting on corporate and individual performance objectives are 80% and 20%, respectively.
- For other NEOs, 1 in 4 companies include Business Unit objectives, with an average weighting of 31% Corporate, 21% Individual, and 48% Business Unit.
- At the median, a total of 5 STIP metrics are used in the Corporate component, with financial metrics emphasized in the weighting.
Environmental, Social and Governance (ESG) Metrics
- ESG metrics are well integrated into STIPs by most companies, with a median weighting of 15% of the overall corporate performance.
- The use of ESG metrics reflects companies' broader commitment to sustainable and responsible business practices.
- ESG focus areas are very diverse and vary by sector. Laulima will soon provide a more in-depth analysis on this topic.
⁴ Median is computed excluding zeros (i.e. includes only companies applying the stated metrics).
Performance Multipliers
- Corporate performance multipliers range from 84% at P25 to 130% at P75.
- Individual performance multipliers are fairly consistent between CEO and other NEOs, and are typically 10 to 20 percentage points above the corporate performance multipliers.
- Where used, 83% of companies reported above target payout for the CEO's individual performance as compared to 61% with above target payout for corporate performance.
- The Energy sector saw the highest overall performance multipliers, with an average of 137%, whereas the Materials sector multipliers were mostly below target, with an average of 90%.
- Most companies disclose that the board may exercise its discretion to adjust STIP payouts. This year, 10 companies exercised discretion to better reflect performance and/or align payouts with the shareholder experience by neutralizing for items outside the company's control. Adjustments range from -9% to +10%. All but one company applied negative discretion. Two companies in the Materials sector reduced STIP payouts due to fatalities.

There have not been material changes to STIP design among TSX60 companies in recent years. However, we do continue to see companies reviewing their performance metrics and corporate scorecards to align with evolving business priorities. Our analysis once again confirms that individual performance multipliers are often rated more generously than corporate performance.
With a growing emphasis on ESG (which can be difficult to measure objectively) and the use of other strategic/qualitative metrics, it will be important for companies to ensure that overall STIP payouts remain reasonably aligned with financial performance and the shareholder experience, and remain disciplined on objectively evaluating performance outcomes on more qualitative individual and corporate performance metrics.
Stay tuned for more TSX60 executive compensation insights in the coming weeks.
For more information, contact us at info@laulimaconsulting.com.
Read more articles
SEE ALL






.svg)


Dropdown